A Data Investigation · May 2026

Invest Like
the Best

Looking into the portfolios of some of India's “chosen” investors.

Scroll to begin ↓

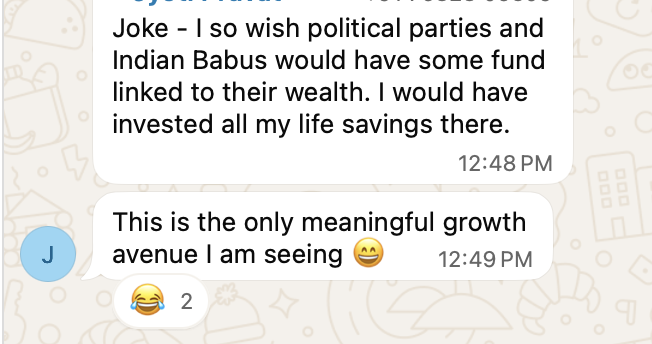
WhatsApp chat about investing in politician portfolios

> Loading 543 candidate affidavits...

> Extracting equities, mutual funds, gold, silver...

> Matching to BSE/NSE tickers via EQUITY_L.csv...

> Matching mutual funds via AMFI NAV API...

> 104 trackable portfolios reconstructed.

> Setting baseline: May 28, 2024 (nomination period)

> Fetching current prices: May 23, 2026

> Pipeline complete. Building indices...

104 Portfolios 150+ Securities Nifty 50: +3.63%

Key Finding

+7.40%

The typical (median) MP portfolio, ex promoter holdings, returned +7.40% — more than double the Nifty 50's +3.63%. And 63.5% of trackable portfolios beat the benchmark.

The Spark

Last week, on an investing focused WhatsApp group I am on, someone posted this:

A joke about political parties being the only "meaningful growth avenue" in India. But it got me thinking.

The Investigation

I looked through the affidavits MPs filed at the time of their election on their assets, and extracted just the publicly tradable assets.

I parsed the financial disclosures of all 543 Lok Sabha candidates elected in May 2024, matching every declared stock and mutual fund to live market tickers. Of those 543 MPs, only 104 held portfolios with enough publicly tradable securities to fully reconstruct — the rest declared primarily property, vehicles, or cash with no trackable market instruments.

Note: Massive promoter holdings — like Apollo Hospitals (Rs 2,500+ Cr), Jindal Steel, and IMFA — are excluded from the returns analysis.1

The Discovery
The results were really fascinating.

Chapter 1

MPs vs. the broader market.

104 reconstructed political portfolios, benchmarked against the Nifty 50 over a two-year tracking window from the nomination period (May 2024) to today.

Aggregate Returns (%)

Key finding: The Nifty 50 returned a moderate +3.63%. MPs' returns (ex promoter holdings) came in at an asset-weighted +6.48%, while the typical (median) MP returned +7.40% — more than double the benchmark. 63.5% of trackable portfolios beat Nifty.

Including family promoter holdings (Apollo, Jindal, IMFA), the total combined political assets index grew by +38.71% — from Rs 2,919 Cr to Rs 4,050 Cr.

A few caveats

  1. This is not a live portfolio — figures are from the 2024 affidavits; holdings may have changed since. Returns shown assumes May 2024 as the baseline
  2. This data does not imply impropriety (if anything, it implies propriety): these MPs disclosed these holdings; any impropriety, if it exists, is more likely in undisclosed positions.
  3. This is not investment advice, purely for informational purposes.
  4. This is a hobby project — there may be minor errors in the asset-holding data, especially for small holdings. The major insights, however, have been checked multiple times.

Chapter 2

The portfolio leaderboard.

Who are the most successful individual political investors — and whose portfolios suffered massive setbacks?

Chapter 3

Spouses, super-pickers, and stock trophies.

Political spouses outperform the MPs themselves.

Self / HUF

Primary Portfolio

Portfolios92
Asset-Weighted Return+6.35%
Median Return+6.88%
AUMRs 158.82 Cr
vs
Winner

Spouse / Dependent

Parallel Portfolio

Portfolios54
Asset-Weighted Return+6.81%
Median Return+8.37%
AUMRs 49.98 Cr

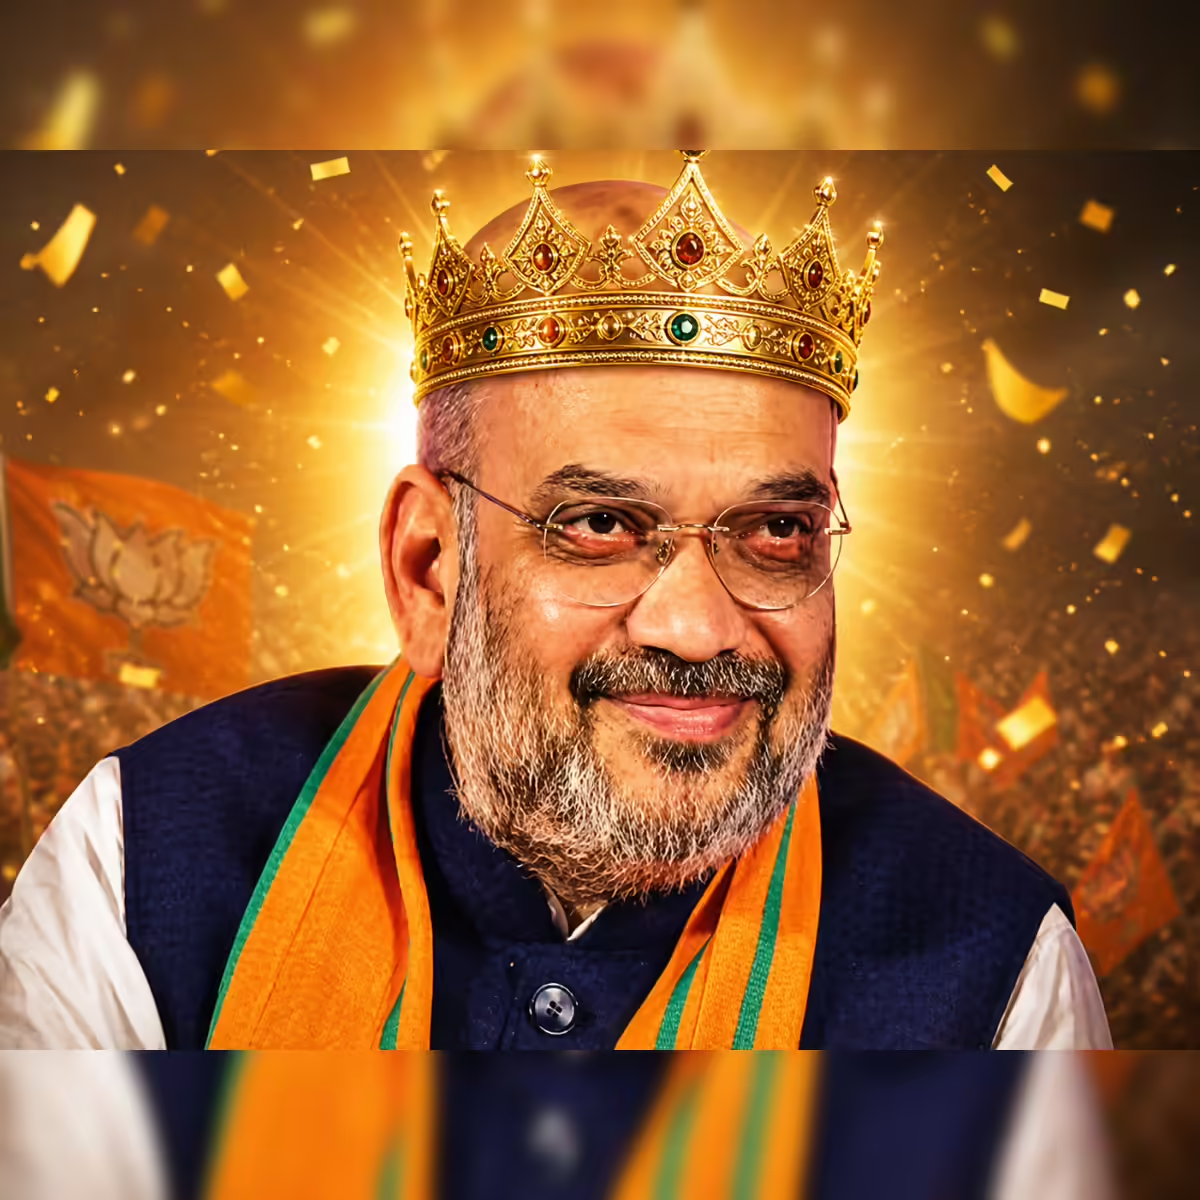
Amit Shah, illustrated with a crown — King of the Stock Pickers

King of the Stock Pickers

Amit Shah.

While other MPs scored singular home runs on small portfolios, Home Minister Amit Shah managed an institutional-grade portfolio of Rs 32+ Crore spread across 150+ stocks — with 30 separate positions returning ≥ +30%.

Top 5 Winning Picks

StockTickerReturn
Tera SoftwareTERASOFT+435.2%
Garware Hi-TechGRWRHITECH+244.3%
Hitachi EnergyPOWERINDIA+240.8%
Mcleod RusselMCLEODRUSS+183.6%
S.J.S. EnterprisesSJS+172.1%

The Super Pickers

Who else consistently picked winners?

MPs ranked by number of individual equity holdings returning ≥ +30%. Amit Shah dominates, but a long tail of consistent stock-pickers sits beneath him.

# MP Party Winning Holdings (≥ +30%)Picks Primary Driver

By Political Party

Which party's MPs invest best?

Aggregated discretionary returns by party (≥ 2 trackable portfolios). TDP leads on aggregate returns; BJP leads on median return — both comfortably above the Nifty 50's +3.63%.

# Party MPs AUM (Cr) Aggregate Return Median Return Note

Chapter 4

What lawmakers prefer.

Where do they actually park their money — and how have those choices performed?

Popular Stock Picks

The popular picks weren't the winning picks.

By number of MPs holding: the three most popular names — Reliance, HDFC Bank, and ITC — collectively underperformed. Reliance (18 holders) returned −5.8%; ITC (14 holders) dropped −20.7%; Jio Financial (12 holders) cratered −32.7%.

# Company MPs Holding AUM (Cr) Return

Popular Mutual Funds

The mutual fund picks fared much better.

By number of MPs holding: in sharp contrast to direct equities, the most popular mutual fund schemes delivered consistent double-digit returns. The standout: Kotak Global Emerging Market FOF, held by 5 MPs and returning +82.0%.

# Scheme MPs Holding AUM (Cr) Return

Global Exposure

The biggest returns came from outside India.

A handful of MPs diversified into US tech, Nasdaq trackers, China tech ETFs, and gold FOFs — and were rewarded with returns that dwarfed the domestic market. The single best individual position in any MP's portfolio is a Nasdaq 100 FOF, up +112.4%.

Chapter 5

Gold & silver.

Physical gold and silver represent a massive store of value among Indian lawmakers. The price surge over two years has created extraordinary paper gains.

Physical Gold

2024 Rs 281.22 Cr
+118.67%
2026 Rs 614.96 Cr

854.65 kg of physical gold across all MP portfolios · drag a coin to spin it

Physical Silver

2024 Rs 12.89 Cr
+205.70%
2026 Rs 39.40 Cr

5,063.93 kg of physical silver across all MP portfolios · drag a coin to spin it


Top 5 Gold Holders

Top 5 Silver Holders


Precious metals by political party

Ranked by 2024 declared value, with a dedicated coalition row aggregating the 7 NDA parties present in the dataset (BJP, TDP, JD(U), SHS-Shinde, LJP-RV, JD(S), JSP). Six smaller NDA allies (RLD, NCP-Ajit Pawar, AGP, AJSU, Apna Dal, HAM, SKM) had no trackable precious-metal declarations in the affidavit feed.

# Party MPs Gold (kg) Silver (kg) Value 2024 Value 2026 Gain

Chapter 6

The MP Index & MF Basket.

What if we pooled all the MPs' capital and ran it as two giant index funds? By establishing a dual threshold—capturing major direct allocations (aggregate current AUM ≥ ₹2.0 Crores) and strategic outperformers/underperformers (AUM ≥ ₹25 Lakhs with Return ≥ +25% or ≤ -15%)—here is how their core portfolios look.

The MP Stock Index

Ex-promoter direct equities (High-Conviction) · Total AUM: Rs 72.80 Cr

Stocks ₹72.8 Cr

The MP Mutual Fund Basket

All mutual fund schemes (High-Conviction) · Total AUM: Rs 44.98 Cr

Funds ₹45.0 Cr

Key Insight: By filtering out hundreds of tiny, fragmented, low-value bets and evaluating both capital size and return performance, we gain a clean look at the lawmakers' core allocations. The MP Stock Index is highly focused on large-cap picks, with United Spirits (8.15%) and L&T (7.36%) carrying the heaviest weights, but 52.95% remains spread across other active direct equities. In the Mutual Fund Basket, the **HSBC Money Market Fund (25.01%)**—a single massive cash parking scheme held by Naveen Jindal—stands out, while the other **74.99%** of the basket is highly concentrated in well-regarded blue-chip and low-duration schemes, dropping the "Others" category to a highly focused **15.57%**.

Explore Candidate Portfolios

Search for any MP to see their listed stock and mutual fund holdings, total asset values, and return metrics.

Notes & Methodology

  1. Promoter holdings excluded: MPs with dominant promoter-category shareholdings — Konda Vishweshwar Reddy (Apollo Hospitals, Rs 2,500+ Cr), Naveen Jindal (Jindal Steel/JSW), and Baijayant Panda (IMFA) — are excluded from the returns analysis. Including them would skew the aggregate by their corporate stakes, which are not meaningful investment positions.
  2. Eastern Silk Industries: BJP MP Mukeshkumar Dalal's holding in Eastern Silk Industries (EASTSILK) initially showed an artificial +3,054% return in raw data. The NCLT completely extinguished the equity capital; the shares are valued at Rs 0 (−100%).
  3. Why 104 portfolios: Of 543 elected MPs, only 104 filed affidavits with publicly tradable equities or mutual funds that could be matched to live market tickers. The remaining MPs declared assets consisting primarily of property, vehicles, cash, or fixed deposits — none of which have trackable market prices.
  4. Raymond demerger correction: Two MPs (Chhatrapati Shahu Shahaji, Brijendra Singh Ola) showed paper losses of −74.6% in Raymond Ltd. driven by the 2024 Raymond Lifestyle and 2025 Raymond Realty demergers (4:5 and 1:1 share allocations respectively). Once the demerged share value is added back, the audited residual return is −22.8% — a much smaller, wealth-neutral repricing rather than a real capital loss.
  5. Pricing methodology: Nifty 50 baseline 22,888.15 (close, 28 May 2024) → current 23,817.85 = +4.06%. Listed equities priced via Yahoo Finance close feeds with audited split/bonus handling. Mutual fund NAVs fetched from AMFI via api.mfapi.in, matched to the nearest trading day in June 2024. Physical gold/silver back-calculated where only INR values were declared, using IBJA benchmarks of ₹7,293/g gold and ₹96.50/g silver (May 2024).
  6. Data sources: MyNeta Lok Sabha 2024 candidate affidavits · Election Commission of India · Yahoo Finance price feeds · AMFI NAV APIs · Indian Bullion and Jewellers Association (IBJA) gold/silver benchmarks. Baseline date: May 28, 2024. Current date: May 23, 2026.